Data Solutions

Transform your data into insightful dashboards and automate tasks.

An iPad displaying data visualization content next to a book titled 'Data Science for Business.' The iPad is showing notes and a diagram about dashboard design, accompanied by a stylus placed between the iPad and the book.
Excel Automation

Streamline processes and enhance productivity through automation solutions.

A laptop displays a detailed financial chart with lines showing data trends. In the background, a person is partially visible, wearing a dark shirt with the words 'most valuable' and some logos printed on it. The setting appears to be a modern workspace.
A digital screen displaying analytical data with line graphs, histograms, and numerical values. The data is presented in a user-friendly interface with different shades of blue used to distinguish various elements.
Hands typing on a laptop keyboard with a screen displaying financial graphs and stock market data. Multiple charts and numbers are visible, indicating online trading or financial analysis.
Dashboard Design

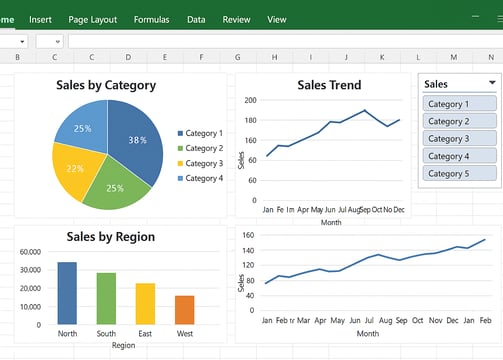
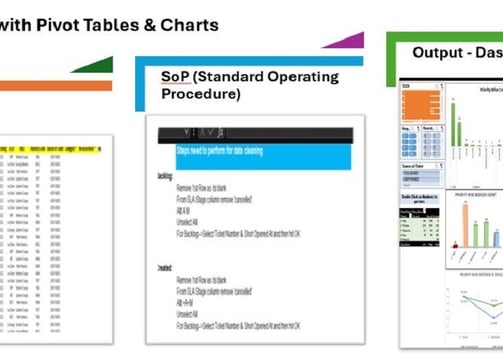
Create impactful dashboards that visualize data for better decisions.